4QFY2019 Result Update | Steel & Power
May 24, 2019
Jindal Steel & Power
BUY
CMP
`152
Target Price
`249
Investment Period
12 Months
Performance Update
INR Cr.
Q4FY19
Q4FY18
% chg. (yoy) Q3FY19
% chg. (qoq)
Stock Info
Sector
Steel & Power
Total Income
10,026
8,692
15
9,514
5
Market Cap (` cr)
12,560
Operating profit
1,844
2,230
-17.30
1,859
-1
Net Debt (` cr)
38,518
OPM (%)
18.4
25.9
-748.6
19.5
-114
Beta
1.9
PAT
-2714
-333
NA
-307
783
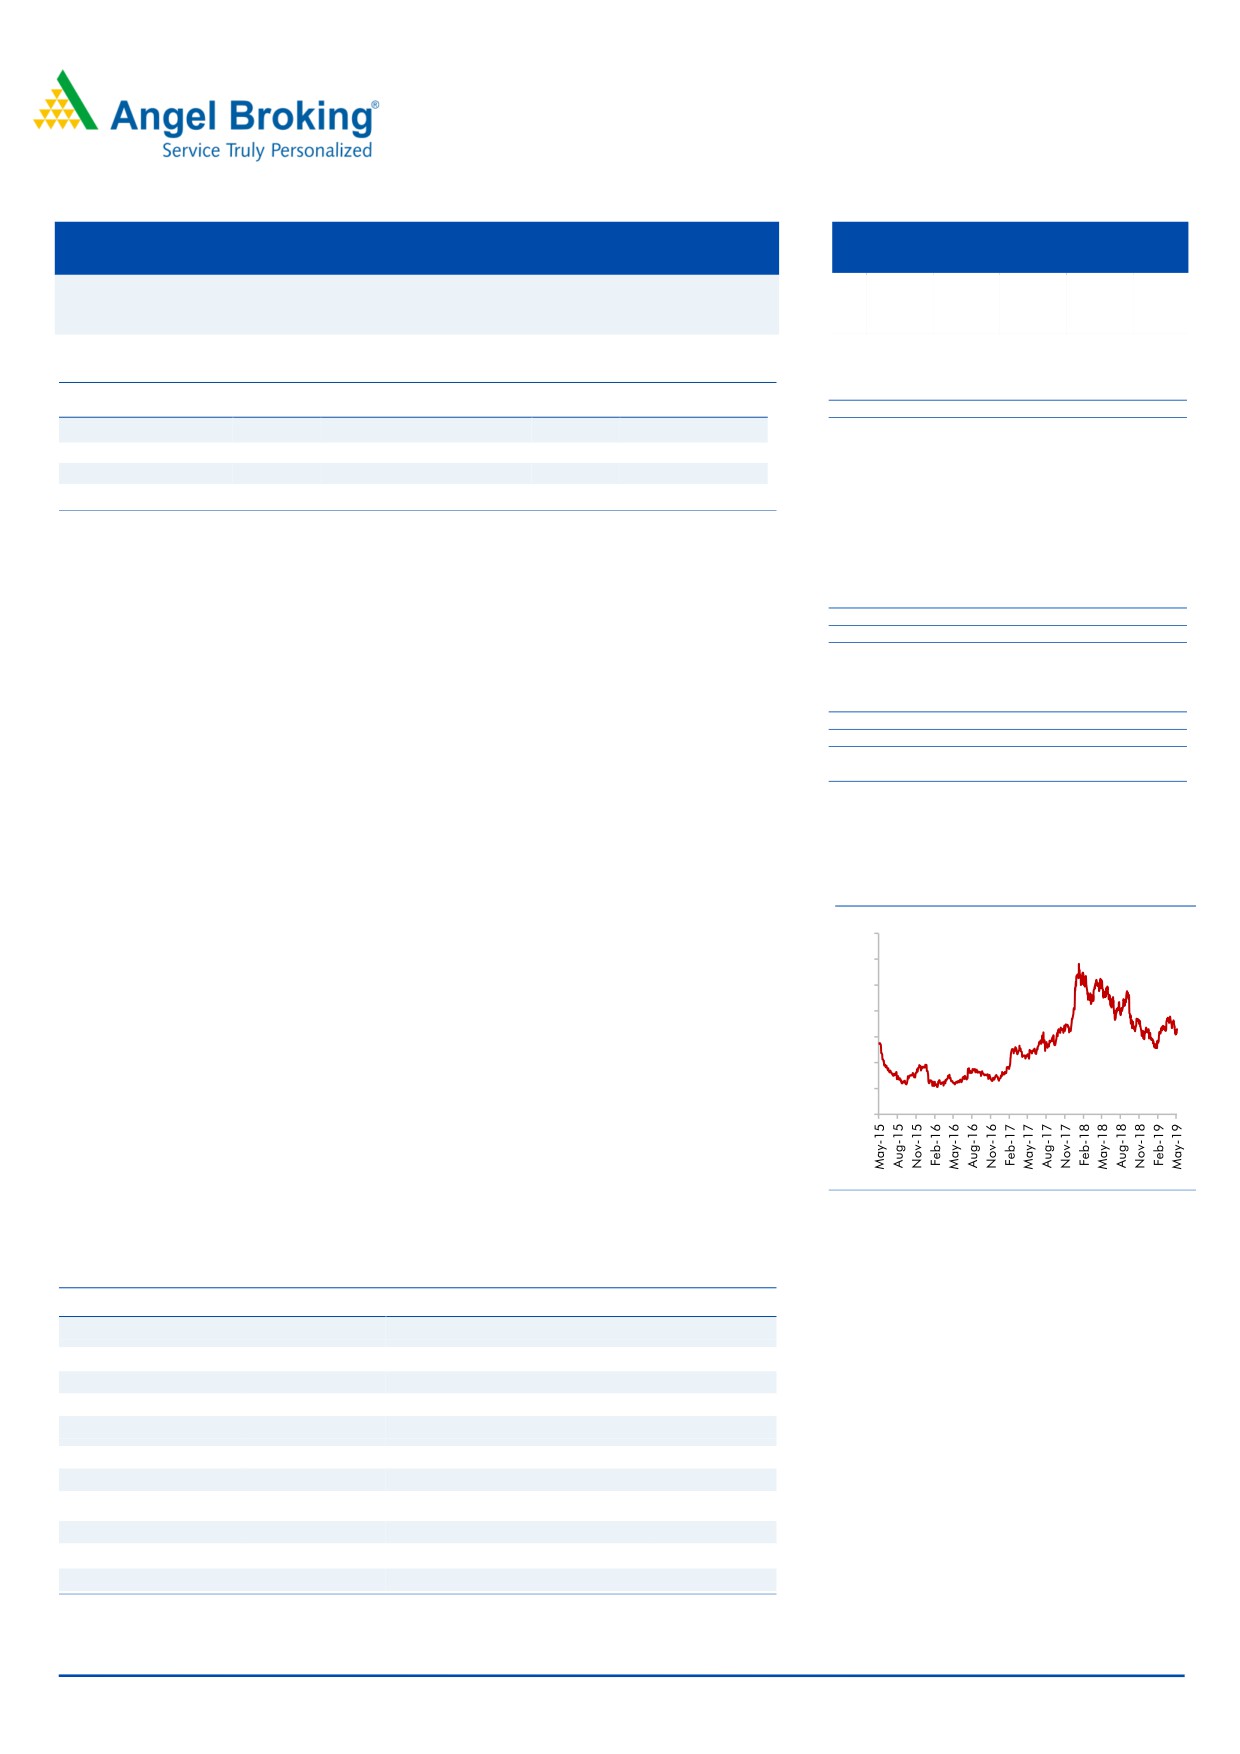
52 Week High / Low
279/125
Avg. weekly Volume
976,539
Source: Company, Angel Research
Face Value (`)
1
BSE Sensex
38,811
Nifty
11,657
Reuters Code
JNSP.BO
For Q4FY2019, on consolidated basis, JSPL has reported 15% yoy growth to `10,026cr,
Bloomberg Code
JNSP IN
primarily on account of robust performance in domestic steel business and improved
Shareholding Pattern (%)
realizations. However, during the quarter, raw material prices have increased
Promoters
60.1
substantially resulting in reduction of operating margin by 750bps to 18.5%. Operating
MF / Banks / Indian Fls
14.5
profit has reduced by 17% yoy basis to `1,841cr. During the quarter, management has
FII / NRIs / OCBs
16.1
charged various one-time adjustments like (a) depreciation includes impairment of
Indian Public / Others
9.3
Australian mine due to downward revolution of asset worth `1260cr; (b) exceptional
Abs.(%)
3m
1yr
3yr
item of `1,733cr includes write-off of coal levy charges, write-off of industrial incentive
Sensex
7.7
11.3
41.0
and electricity duty benefits and shut down of Barbil Power plant, resulting in a loss of
JSPL
1.4
(36.7)
11.5
`2,714cr as against loss of `333cr in the corresponding quarter last year.
Going forward, we expect EBIDTA/tonne to sustain around `10,000/tonne owing to
stable global steel prices, increasing domestic consumption of steel, internal operational
efficiency on the back of further ramp-up of Angul plant.
3years performance chart
JPL: During Q4FY2019, despite the low coal availability through e-auction, JPL as
350
registered a growth of 5% yoy to `999cr vs. `947cr in the corresponding quarter last
300
year. The company has generated 2,609 million units similar to that in corresponding
250
quarter last year, resulting in flattish operating profit at `267cr.
200
150
Outlook & Valuation: Given the ongoing global trade concerns, we expect steel prices to
100
remain volatile along with increasing iron ore prices due to Vale incidence. However, we
project that domestic demand will continue to remain positive for steel and power
50
sectors on long term basis, and expect JSPL to perform well in coming years along with
0
the ramp-up of Angul plant and realizations in steel segment. We also anticipate that
power segment will perform well on account of improving visibility of PPA (short and
long term) and various efforts by GoI for availability of fuel to power generators. We
maintain our Buy recommendation on JSPL with a Target Price of `250 with a potential
Source: Company, Angel Research
upside of 64% over a period of next 9-12 months.
Key Financials
Y/E March (` cr)
FY18
FY19
FY20E
FY21E
Net Sales
27,383
39,372
45,561
47,450
% chg
34
44
16
4
EBIDTA
5,882
8,406
10,190
11,419
% chg
36
43
21
12
EBITDA (%)
21%
21%
22%
24%
EPS (Rs)
(17)
(25)
21
33
P/E (x)
-
(6.1)
7.1
4.5
P/BV (x)
0.5
0.5
0.5
0.4
RoE (%)
-
(8.6)
6.9
9.4
Kripashankar Maurya
RoCE (%)
2.9
4.4
8.8
10.4
022-39357800 Ext: 6004
EV/EBITDA
9.1
5.8
4.4
3.6
Source: Company, Angel Research
Valuation done based on 23nd May, 2019 closing price
Please refer to important disclosures at the end of this report
1
JSPL | 4QFY2019 Result Update
Exhibit 1: 4QFY2019 Performance
In Cr
Q4FY19
Q4FY18
Q3FY19
YOY %
QOQ%
Net Sales
10026
8616
9514
16.4%
5%
Total Income
10159
8692
9644
17%
5%
Total Expenditure
8314
6462
7786
29%
7%
Raw Material Consumed
3680
2993
3856
23%
-5%
Stock Adjustment
176
-50
78
-451%
124%
Purchase of Finished Goods
489
79
280
521%
75%
COGS
4345
3021
4357
44%
0%
Employee Expenses
279
238
269
17%
4%
Other Expenses
3623
3297
3222
10%
12%
Captive sales
68
-94
-63
Raw Material Consumed
37%
35%
41%
Stock Adjustment
2%
-1%
1%
Purchase of Finished Goods
5%
1%
3%
COGS
43%
35%
46%
Gross Margin %
57%
65%
55%
Employee Expenses
3%
3%
3%
Other Expenses
36%
38%
34%
EBITDA
1844
2230
1859
-17%
5%
Other Income
0.00
0.5
0.0
-100%
NA!
Interest
1163
1071
973
9%
20%
PBDT
681
1159
886
-41%
-23%
Depreciation
2373
960
1039
147%
128%
PBT
-1692
199
-153
-949%
1003%
Exceptional Item (gain)/loss
1734
438
0
NA
Tax
-712
94
154
-854%
-18%
PAT
-2714
-333
-307
715%
24%
Ratios
BPS
BPS
EBITDA margin (%)
18.4
25.9
19.5
-749
-114
PAT margin %
0
0
-3.23
-23
296
Tax rate %
NA
47
NA
NA
NA
Source: Company, Angel Research
Company background
JSPL is part OP Jindal Group with presence in steel, power and mining sectors.
JSPL has capacity of 10.6 MTPA crude steel and 3,400MW of power generation
capacity through its subsidiary Jindal Power Limited (JPL).
JSPL operates the largest coal based sponge iron plant in the world and has an
installed capacity of 3 MTPA (million tonnes per annum) of steel at Raigarh in
Chhattisgarh. Moreover, it has set up a 0.6 MTPA wire rod mill and a 1 MTPA
capacity bar mill at Patratu, Jharkhand, a medium and light structural mill at
Raigarh, Chhattisgarh and a 2.5 MTPA steel melting shop and a plate mill to
produce up to 5 meter-wide plates at Angul, Odisha. In Oman (Middle East), the
company has a 2 MTPA integrated steel plant with a 1.5 MTPA gas-based Hot
Briquetted Iron (HBI) plant.
May 24, 2019
2
JSPL | 4QFY2019 Result Update
JSPL has installed power capacity of 3,400MW through its wholly owned subsidiary
Jindal Power Limited (JPL). In FY2019, JPL had Power Purchase Agreement (PPA) of
1,020MW and it operates at 45-50% utilization.
Con-call highlights Q4FY2019
Management has guided for further debt reduction of
`8,000cr in
FY2020, of which `5,000cr would come from operations and remaining
`3,000cr will come from Monetization of assets. FY2019 debt stood at
`39,084cr.
Expect EBIDTA/tone to improve by `1,000-1,500/tones due to operational
efficiency primarily on account of ramp-up in Angul plant.
Expect to receive USD150-200mn from disinvestment of African asset,
USD100mn from Iron ore mine in Africa and USD200-300mn from part
of OMAN business.
Depreciation of `5,480cr includes `1,260cr impairment cost of Australian
mine due to downward revolution of asset from AUD750mn to
AUD252mn .
Exceptional item includes
1) write-off of coal levy charges paid in
December
2013 of
`1274,
`308cr against benefit promised by
Chhattisgarh government through industrial incentive
2) Electricity duty,
but later on the decision was withdrawn and 3) `71cr on account of shut
down of Barbil Power plant.
Total capex outlay for FY20 would be near `1,000cr.
Increase in finance cost due to rise in interest cost and interest pertaining
to LC discounting.
Management expects to participate in upcoming iron mine auction, which
may start very soon for arrangement of mines on account of expiry of
mining license.
In Rail segment, JSPL is running at 85% utilization (0.7mn capacity) and
expects to increase the capacity to close to 1 million tonne. Rail segments
have seen higher realization of 20% on new orders as compared to
previous orders.
Expect 515MW of PPA from NHPC currently, JPL emerged as L1 bidder.
From April 2019, power segment has seen improvement in PLF and now
producing 1,700 megawatts, up from the average 1,400 megawatts, this
will lead improvement in PLF from 34% to 50%.
Management believes this can also improve further once NHPC
aggregation tender starts by October where JPL is L1 bidder.
In recent development, TANGEDCO will start paying its dues to JPL for the
change in Law.
In another development, TANGEDCO has started paying JPL dues, which
JPL filed last year.
Valuation Assumption
We value the stock on Asset based approach, valuing each segment’s assets at
discount to its peer companies, while applying multiple to respective asset. We
arrive at the SOTP based target price of `250.
May 24, 2019
3
JSPL | 4QFY2019 Result Update
Exhibit 2: Asset Based SOTP Valuation
Segments
Capacity
Multiple (X)
Total INR Cr.
Power- (EV/MW)*
3,400
4
13,600
Steel- (EV/Tone)#
10.6
4,800
50,880
Consol Enterprise Value (A)
64,480
Add
CWIP (B)
2,905
Cash (c )
421
Subtotal (D)=A+B+C
67,806
Less
Debt FY19 (E)
39,084
Equity Value ( F)= (D)-(E)
25,396
No of share cr (G)^
102
Value per share INR (F)/(G)
250
CMP
152
Upside
61%
Source: Company, Angel Research
Note:
*Disinvestment announced in May 2016 by JSW Energy to acquire 1,000MW
(4X250) Tamnar Thermal Power Plant from JSPL.
Valuing Power segment by applying multiple of `4cr/MW at 12% discount to JSW
Energy’s EV `4.6cr/MW.
# Valuing the steel segment by applying multiple of `4,800cr/MTPA at 19%
discount to JSW Steel’s EV/tonne of `5,907cr/MTPA.
Exhibit 3: Peer Asset Valuation
Particular
JSW steel
Tata Steel
JSW Energy
EV/Tonne
5,907
5,133
EV/MW
4.5
Crude steel Capacity (MTPA)
18
28
Power Generation Capacity (MW)
4,451
Source: Company, Angel Research
May 24, 2019
4
JSPL | 4QFY2019 Result Update
Income Statement
Y/E March (` cr)
FY18
FY19
FY20E
FY21E
Total operating income
27,383
39,372
45,561
47,450
% chg
30
44
16
4
Total Expenditure
21,502
30,967
35,372
36,031
Raw Material
9,378
15,274
15,079
15,720
Personnel
956
1,072
1,591
1,591
Purchase of finished goods
324
1,186
451
470
Others Expenses
10,843
13,434
18,251
18,251
EBIDTA
5,882
8,406
10,190
11,419
% chg
36
43
21
12
(% of Net Sales)
21.5
21.3
22.4
24.1
Depreciation& Amortization
3,883
5,480
4,444
4,689
EBIT
1,999
2,925
5,745
6,729
% chg
415
46
96
17
(% of Net Sales)
7
7
13
14
Interest & other Charges
3,866
4,264
3,065
2,537
Other Income
3
16
16
16
Extraordinary Items
(577)
1,478
-
1
Recurring PBT
-1,287
-2,801
2,696
4,207
% chg
(52)
118
(196)
56
Tax
-240
-390
620
968
PAT (reported)
-1,047
-2,411
2,076
3,239
% chg
(52)
130
(186)
56
(% of Net Sales)
-3.8
-6.1
4.6
6.8
Basic & Fully Diluted EPS (Rs)
-17
-25
21
33
% chg
(36)
48
(186)
56
Source: Company, Angel Research
May 24, 2019
5
JSPL | 4QFY2019 Result Update
Balance sheet
Y/E March (` cr)
FY18
FY19
FY20E
FY21E
SOURCES OF FUNDS
Equity Share Capital
97
97
97
97
Reserves& Surplus
30,283
32,326
34,402
37,643
Shareholders Funds
30,380
32,423
34,499
37,739
Equity Share warrant
5
5
5
5
Minority Interest
440
-301
-301
-301
Total Loans
39,198
34,766
30,824
26,824
Other Liabilities
6,074
6,115
5,901
5,940
Total Liabilities
76097
73008
70928
70207
APPLICATION OF FUNDS
Net Block
69,550
70,745
68,689
68,103
Capital Work-in-Progress
3,877
2,905
2,064
2,064
Investments
146
150
150
146
Long Term Loans & Advances
-
-
-
Current Assets
14,313
14,306
16,311
16,869
Inventories
4,960
6,510
7,408
7,851
Sundry Debtors
1,826
3,029
3,488
3,636
Cash & Cash Equivalent
468
421
543
233
Loans & Advances
6,589
4,089
4,507
4,698
Investments & Others
471
257
365
450
Current liabilities
13,133
16,578
18,088
18,854
Net Current Assets
1,180
-2,271
-1,778
-1,985
Other Non Current Asset
1,343
1,479
1,803
1,879
Total Assets
76097
73007
70928
70207
Source: Company, Angel Research
Cash Flow
Y/E March (` cr)
FY18
FY19
FY20E
FY21E
Profit before tax
(1,287)
(2,801)
2,696
4,207
Depreciation
3,883
5,480
4,444
4,689
Change in Working Capital
Interest / Dividend (Net)
3,866
4,264
3,065
2,537
Direct taxes paid
(240)
(390)
620
968
Others
(516)
792
(341)
318
Cash Flow from Operations
5,706
7,345
10,484
12,720
(Inc.)/ Dec. in Fixed Assets
(2,000)
(2,828)
(4,998)
(4,997)
(Inc.)/ Dec. in Investments
175
(46)
(500)
(496)
Cash Flow from Investing
(1,825)
(1,903)
(5,498)
(5,493)
Issue of Equity
1,220
-
-
-
Inc./(Dec.) in loans
-760
-4432
-5000
-5000
Others
(4,325)
(851)
135
(2,537)
Cash Flow from Financing
(3,866)
(5,283)
(4,865)
(7,537)
Inc./(Dec.) in Cash
15
159
122
(310)
Opening Cash balances
247
262
421
543
Closing Cash balances
263
421
543
233
Source: Company, Angel Research
May 24, 2019
6
JSPL | 4QFY2019 Result Update
Key Ratios
Y/E March
FY18
FY19
FY20E
FY21E
P/E (on FDEPS)
-
-6.1
7.1
4.5
P/CEPS
5.2
4.8
2.3
1.9
P/BV
0.5
0.5
0.5
0.4
EV/Sales
2.0
1.2
1.0
0.9
EV/EBITDA
9.1
5.8
4.4
3.6
EV / Total Assets
0.7
0.7
0.6
0.6
Per Share Data (Rs)
EPS (Basic)
-16.8
-24.9
21.4
33.5
EPS (fully diluted)
-16.0
-23.7
20.4
31.6
Cash EPS
29.3
31.7
67.4
81.9
DPS
0.0
0.0
0.0
0.0
Book Value
314
289
310
356
Returns (%)
ROCE
2.9
4.4
8.8
10.4
Angel ROIC (Pre-tax)
2.8
4.2
8.4
9.9
ROE
-5.3
-8.6
6.9
9.4
Turnover ratios (x)
Inventory / Sales (days)
67
61
60
61
Receivables (days)
25
28
28
28
Payables (days)
56
49
49
49
Working capital cycle (ex-cash) (days)
35
40
40
41
Source: Company, Angel Research
May 24, 2019
7
JSPL | 4QFY2019 Result Update
Research Team Tel: 022 - 39357800
DISCLAIMER:
Angel Broking Limited (hereinafter referred to as “Angel”) is a registered Member of National Stock Exchange of India Limited, Bombay
Stock Exchange Limited, Metropolitan Stock Exchange Limited, Multi Commodity Exchange of India Ltd and National Commodity &
Derivatives Exchange Ltd It is also registered as a Depository Participant with CDSL and Portfolio Manager and Investment Adviser with
SEBI. It also has registration with AMFI as a Mutual Fund Distributor. Angel Broking Limited is a registered entity with SEBI for Research
Analyst in terms of SEBI (Research Analyst) Regulations, 2014 vide registration number INH000000164. Angel or its associates has not
been debarred/ suspended by SEBI or any other regulatory authority for accessing /dealing in securities Market. Angel or its
associates/analyst has not received any compensation / managed or co-managed public offering of securities of the company covered
by Analyst during the past twelve months.
This document is solely for the personal information of the recipient, and must not be singularly used as the basis of any investment
decision. Nothing in this document should be construed as investment or financial advice. Each recipient of this document should make
such investigations as they deem necessary to arrive at an independent evaluation of an investment in the securities of the companies
referred to in this document (including the merits and risks involved), and should consult their own advisors to determine the merits and
risks of such an investment.
Reports based on technical and derivative analysis center on studying charts of a stock's price movement, outstanding positions and
trading volume, as opposed to focusing on a company's fundamentals and, as such, may not match with a report on a company's
fundamentals. Investors are advised to refer the Fundamental and Technical Research Reports available on our website to evaluate the
contrary view, if any
The information in this document has been printed on the basis of publicly available information, internal data and other reliable
sources believed to be true, but we do not represent that it is accurate or complete and it should not be relied on as such, as this
document is for general guidance only. Angel Broking Limited or any of its affiliates/ group companies shall not be in any way
responsible for any loss or damage that may arise to any person from any inadvertent error in the information contained in this report.
Angel Broking Limited has not independently verified all the information contained within this document. Accordingly, we cannot testify,
nor make any representation or warranty, express or implied, to the accuracy, contents or data contained within this document. While
Angel Broking Limited endeavors to update on a reasonable basis the information discussed in this material, there may be regulatory,
compliance, or other reasons that prevent us from doing so.
This document is being supplied to you solely for your information, and its contents, information or data may not be reproduced,
redistributed or passed on, directly or indirectly.
Neither Angel Broking Limited, nor its directors, employees or affiliates shall be liable for any loss or damage that may arise from or in
connection with the use of this information.
Disclosure of Interest Statement
Jindal steel & Power
1. Financial interest of research analyst or Angel or his Associate or his relative
No
2. Ownership of 1% or more of the stock by research analyst or Angel or associates or
No
relatives
3. Served as an officer, director or employee of the company covered under Research
No
4. Broking relationship with company covered under Research
No
May 24, 2019
8